The Research Team and Other Support
Institutions
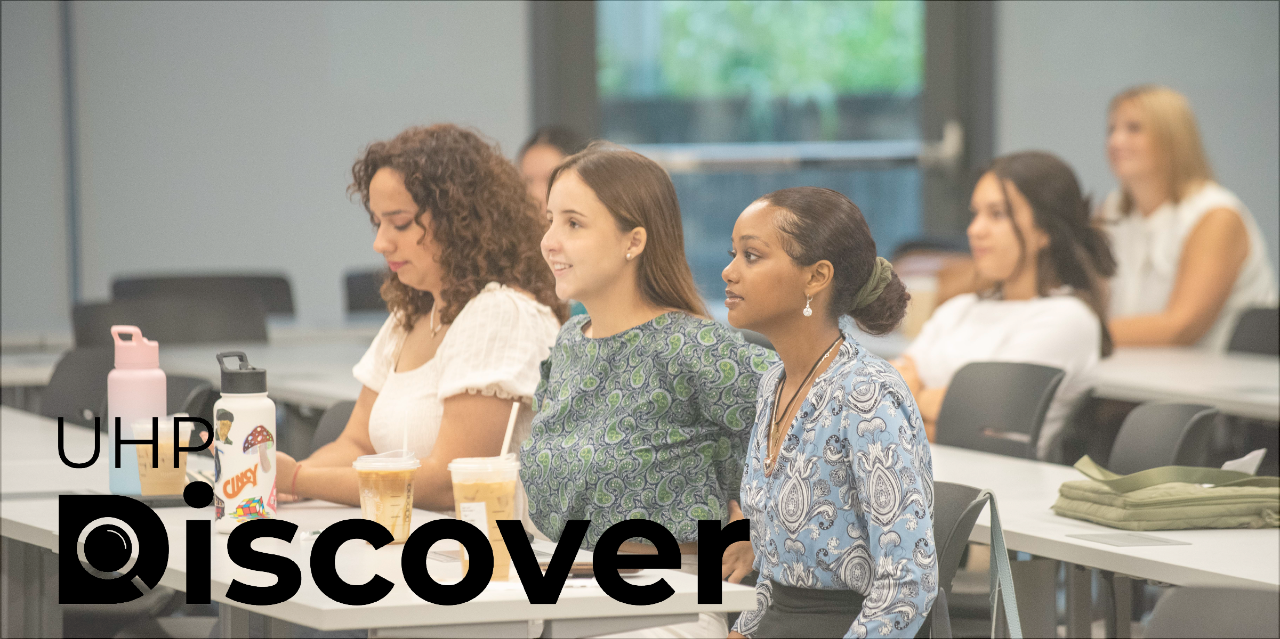
This project happened thanks to the support and funding of “UHP Discover”, a program for University of Cincinnati undergraduate Honors students that pairs them with professors in non-STEMM fields to do research over the summer. I don’t think I would’ve started this project had I not had the opportunity to hire some terrific undergraduate researchers (see below) through Discover UC. It’s a great program.
We were also helped enormously by the University of Cincinnati’s Digital Scholarship Center that introduced us to Tableau, taught us how to use it, and helped us solve myriad problems related to the project. Special thanks to Director James Lee for his help and facilitation.
This project received additional funding from the University of Cincinnati’s College of Arts and Sciences (Faculty Development Grants) and the Latino Faculty Associations’ Small Grants program.
People:
Jocelyn Decker got the project underway, getting most of the articles into the database, and doing most of the initial analysis. Without her, the project never would have gotten off the ground. Jocelyn graduated from the University of Cincinnati in 2021 with a BA in Criminal Justice. She now works as a Court Specialist in the Youth Division of the Public Defender’s Office in Cincinnati.
Amilcar Torres-Enríquez did most of the heavy lifting on the technology side of things along with some important research on the historiography. He also helped with the seemingly never-ending task of cleaning up our spreadsheet. Without Amilcar, it is safe to say that the interactive map would never have happened. Amilcar graduated from the University of Cincinnati in Spring 2022 with a BA in Political Science, International Affairs and Spanish. He is currently taking graduate classes at the University of Cincinnati School of Public and International Affairs and is set to start at the University of Cincinnati College of Law in Fall 2023.
Erin McCabe was our teacher at the Digital Scholarship Center. She walked us through much of the technology, helped us think through and solve the “normalization” problem, and worked closely with Amilcar to get the digital map created. Erin has been with the Digital Scholarship Center since 2018, works on several research teams across disciplines, and acts as liaison between academic and technology units. She previously worked on data analysis projects with academic publishers at JSTOR and in reference services at the Brooklyn branch of Long Island University. She has an undergraduate degree in French from Concordia University in Montréal, and an MLIS with an advanced certificate in Digital Humanities from Pratt Institute in New York.
Jake Pfefferman helped out toward the end of the project, stepping in when some additional close analysis and a keen eye for detail was needed. Jake graduated from the University of Cincinnati with a Bachelor’s of Liberal Arts and is now pursuing an MBA at the University of Northern Kentucky. He hopes to complete his postgraduate program in the next two years while continuing to collaborate on interesting projects within a variety of fields.
Ezra Edgerton stepped in at the eleventh hour to make the “normalization” toggle work on various visualizations and the interactive map. Ezra is the Data Visualization developer for the Digital Scholarship Center. He previously worked on designing and building custom visualizations and running natural language processing models for the DSC as a consultant. He graduated from Grinnell College in 2016 with a BA in Computer Science and Studio Art.


